On Monday the 12th of September 2011 Cambridgeshire Police’s Deputy Chief Constable, John Feavyour, described the force’s telephone answering system as “fragile” and said call answering performance had “fallen through the floor” on a number of occasions over the last year. He said the latest statistics showed particularly poor performance in answering non-emergency calls.
Mr Feavyour was presenting a report to a meeting of the scrutiny committee of Cambridgeshire’s Police Authority which I was observing.
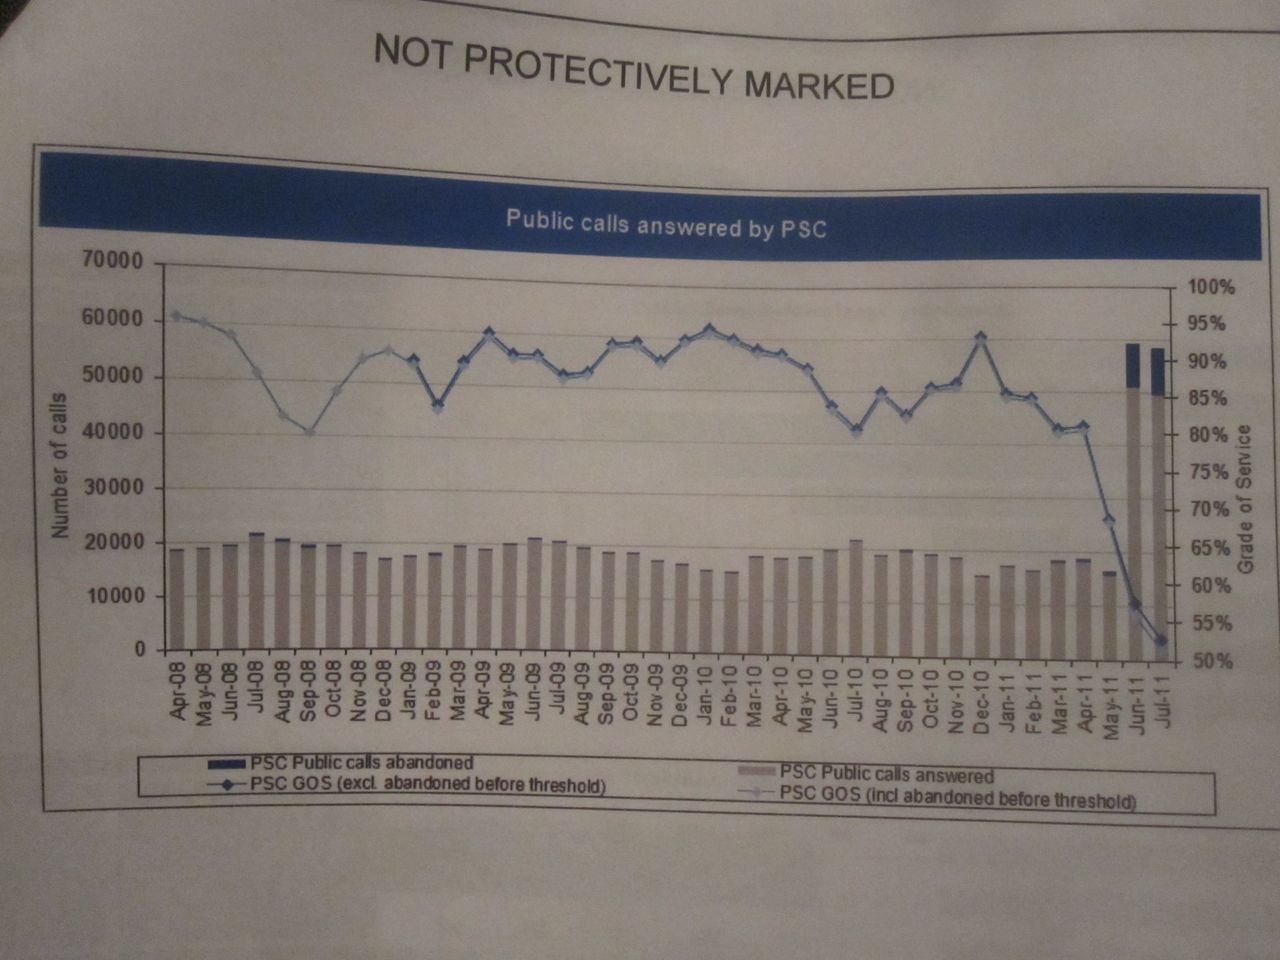
The most recent statistics, for July 2011, show that only around half of calls to the non-emergency number (when its not routed to the force control room) have been getting answered within the (30 second) target time.
As well as the fraction of calls not being answered within the target times; another worrying statistic revealed is the number of calls being abandoned – callers hanging up before their call gets answered. It appears that in a typical month around 5% of non-emergency calls routed to the force control room were being abandoned. In each of June and July 2011(the most recent months for which data was provided) 10,000 of the 60,000 non-emergency calls directed to the Police Service Centre each month were abandoned before they were answered.
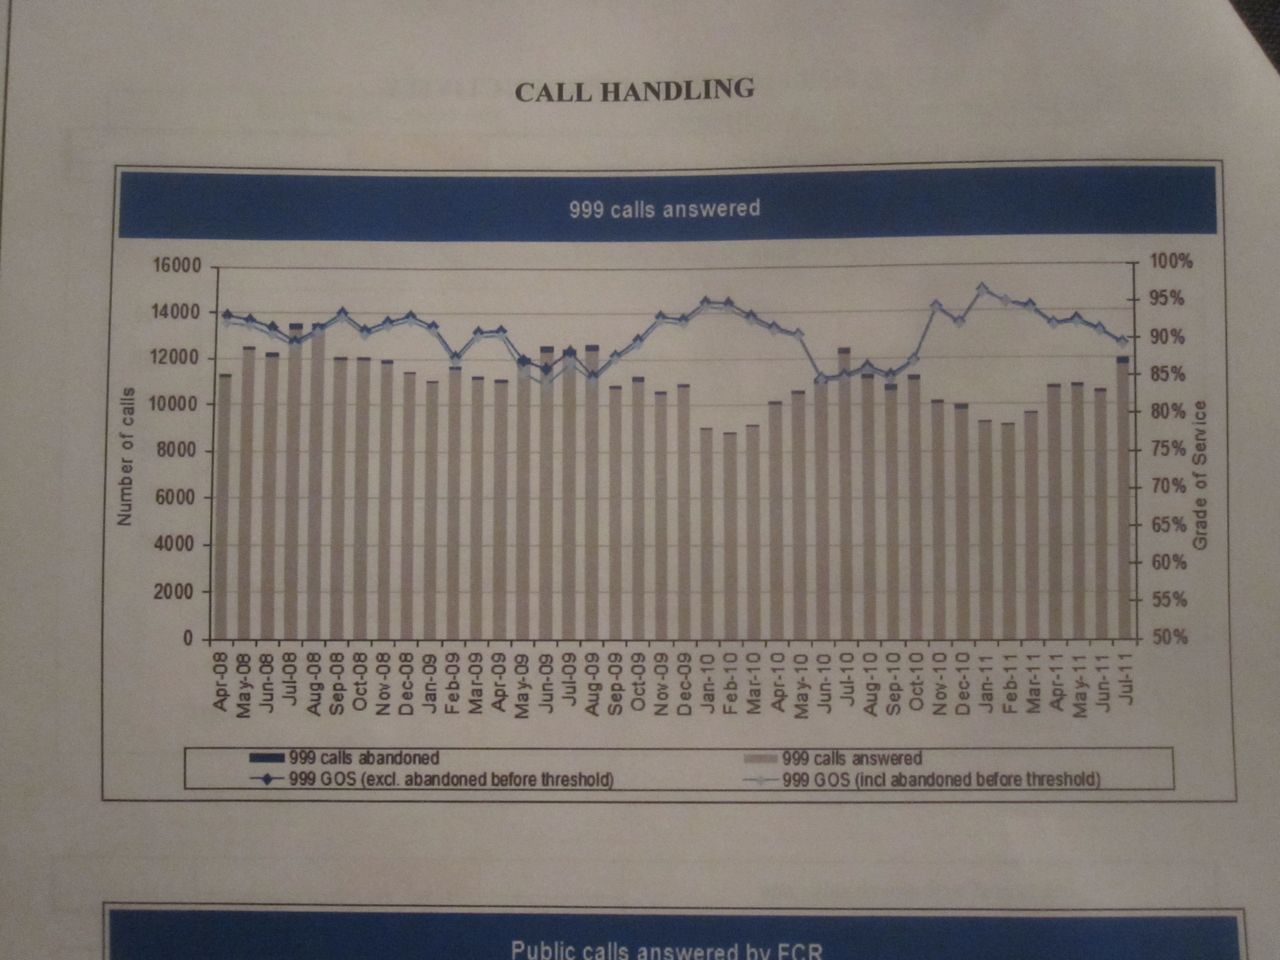
As would be hoped and expected the performance of the 999 system is better, but the statistics released show the force is meeting its (10 second) target for answering 999 calls in less than the 90% of cases which it aspires to. The measure dipped to 85% in the summer of 2010 and is currently at just below 90% and the previous trend was performance falling.
The dips in performance of the 999 system appear to have occurred at the same times as the problems with the non-emergency system.
Graphs
Members of the committee were presented with graphs visualising data on Cambridgeshire Police’s Call handling statistics. Neither the committee, or the public, have been provided with the raw data which would allow investigation of things like how many 999 calls were answered within a longer period, of say, 20 seconds. Without such data I don’t really know how worried I should be about the ~10% or so of 999 calls which are not being answered within the 10 second target; if all were picked up within say 20 seconds I’d be reassured and fairly happy; as it is I’m left wondering.
Graphs were presented relating to performance in respect of :
- 999 Calls
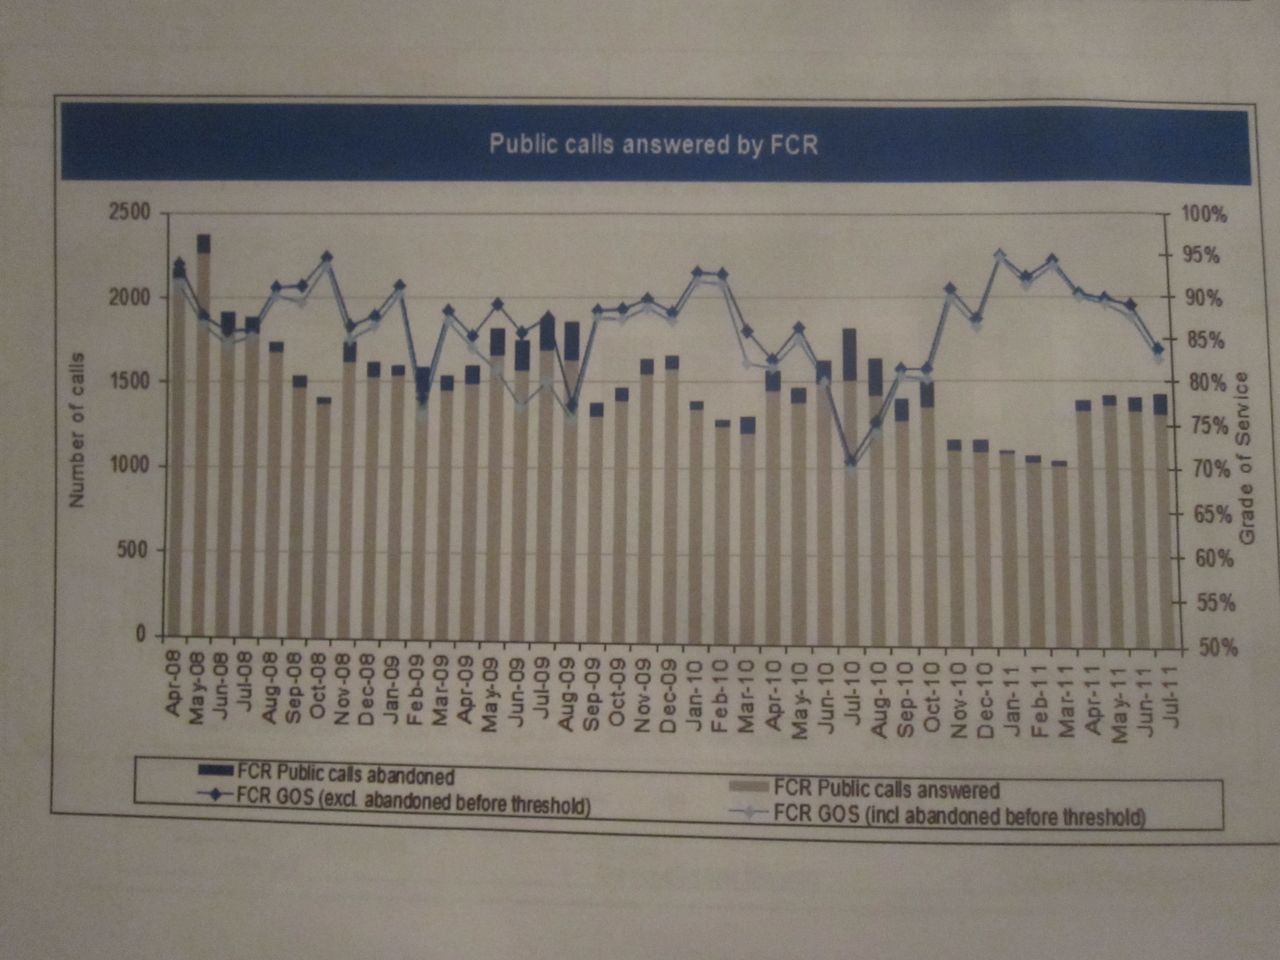
- Public calls answered by the Force Control Room (FRC)
- Public calls answered by the Police Service Centre (PSC)
(I’ve expanded those acronyms which were left unexplained in the document).
I was given a copy of the document and have posted photos of the graphs online (1,2,3).
As I understand it calls to the non-emergency number are generally answered by the Police Service Centre but can be passed onto the Force Control Room. (I’ve personally called the non-emergency number and it’s very confusing having just called the police, for them to say “we’ll put you through to the police”). A report to the Police Authority from 2007 stated that the force control room handled non-emergency calls whenever the Police Service Centre is either closed or experiencing extreme demand. Later reports have stated the Police Service centre [also] takes all calls coming into the force between 6-7am and midnight-1am. I don’t know if that is still the case.
It is hard to work with and comment on the graphs as the definitions of terms on them such as “PSC Grade of Service” were not provided.
When non-emergency calls are transferred to the force control room, a fraction of them somewhere between around 5-10% go unanswered; there have been months where this statistic has gone through bad patches. It is notable that in April and May 2008 there were over 2000 emergency calls a month being answered (or not!) by the Force Control Room whereas by the end of 2010 and into the start of 2011 this dropped by half to around 1000 per month. The latest data shows this running at around 1500 per month.
Clearly there are many questions raised by the data such as why changes in call volume like this have occurred; the most striking is the huge and unexplained increase in the number of public calls which were routed to the Police Service Centre in June and July 2011, up to over 50,000 from a usual level of around 20,000. I first thought it was possible, even probable, that this tripling of the call volume would be one cause of the fall off in performance, but that was not the explanation put forward by Mr Feavyour. Without any explanation for the increase I questioned if the statistics reflected reality; but then realised what may be occurring is those people who have not got through are trying again, so increasing the total number of calls. As even then the figures don’t appear to fully make sense I wonder if there is a fraction of calls being dropped before they are even logged, if the system is becoming overwhelmed.
Causes of the Problems And Authority Members’ Response
Deputy Chief Constable Feavyour explained the problems occurred because of staff absences, holidays etc. He said the force had addressed problems after one dip in performance (presumably that around July 2010) but another problem has been occurring since April 2011, though with lesser impact on 999 and but much worse on the non-emergency calls. He assured the committee that the most up-to-date data he had seen was much better than that shown in the graphs in the report (public officials always say that when being held to account!). Mr Feavyour said he was personally not happy with the force’s performance in this key area being so susceptible to minor staffing issues and gave an assurance that he was looking into it.
None of the members of the police authority committee expressed any concern, or raised any question, in relation to the call handling statistics. They all appeared very happy with what Mr Feavyour had said and the assurances he had given.
The only one to make any related comment was Cambridgeshire County Councillor John Clark (March West, Conservative) who said he’d been given “a very rough time” at a neighbourhood panel meeting from people who’d not been able to get through on the non-emergency number; he admitted he hadn’t had a clue what to say in response and didn’t even know the non-emergency number himself at that point (he’s now learnt 101, but is struggling with 08345 4564564). Presumably if the residents of March West care about things like getting though to the police when they call they’ll boot him out of office at the next election – at least though he said something and after a fashion re-presented some concerns raised by those who elected him to the other committee. The other members, some elected, some not, said nothing.
Looking Back
Historial figures show that the 999 “Grade of Service” has been up to ~98% for long periods of 2007, though has been poor before, hitting a low of 80% in August 2005.
A call handling performance report by the police for September 2008 reported the same issues as appear to be occurring now: a loss of staff from the Police Service Centre leading to significant performance impacts.
The latest performance statistics on call handling available on the force website are from September 2009.
Failure to Publish Papers
The meeting papers published prior to the meeting contained two links for the item under which the call handling performance statistics were presented:
Both links were to the same document. It appears there was an intent to publish both the “pack” of performance data as well as the overview report, but an administrative mistake had been made and only the covering report, which didn’t mention the phone system at all, had been published. I understand that mistakes happen, but note that the running costs for the Police Authority’s administration are around a million pounds a year, and the clerk (grandly titled the Chief Executive) gets paid around £100,000/year. In that context the frequency of failures like this is less tolerable to me.
I also note that it was information of obvious public and press interest which was omitted from the published meeting papers.
15 responses to “Cambridgeshire Police Not Answering Phone”
Interesting graphs. It’s worth noting that the right-hand y-axis doesn’t start at zero, so the grade of service fluctuations are exaggerated. There are clearly some seasonal factors at work – it looks like the grade of service is better in the winter when there are fewer calls. But as you observe it doesn’t explain the huge increase in non-emergency calls in June and July, and consequent plummet in the grade of service. I can only guess that something happened to publicise the non-emergency number much more widely.
Phil,
My guess is the increase was due to people trying multiple times to get through.
I also note the performance against the targets dropped before the call volume, and number of unanswered calls increased, it appears the “Grade of Service” statistic dropping had the potential to draw attention to a problem which then got worse.
The Police Authority have now published the document containing the graphs:
http://www.cambs-pa.gov.uk/user_files/meeting/meeting382/12.09.11%20SC%20-%20Agenda%20Item%209%20-%20Q1%2011-12%20Performance%20Pack.pdf
The Cambridge-News has covered this:
http://www.cambridge-news.co.uk/Home/Police-miss-20000-calls-in-60-days-14092011.htm
This is quite remarkable. There was a time, some years ago, when the call answering rate was really bad and lots of work was put in to deal with it, which worked, but it seems that ‘efficiencies’ have taken their toll.
However, some of the normal stuff in contact centres seems to be lacking, for example “lost call recovery” which, overall, reduces the wait times and retries.
Also, queuing times or at least where you are in the queue in the on-hold chatter can also help.
There are ways to manage queues that, without extra call agents, can still reduce hold times.
Re 2., if the increase were due to people calling multiple times trying to get through, then you would expect the blue “public calls abandoned” part of the bar to be much larger. But the “calls answered” bar suddenly leaps up from 15-20,000 to around 50,000 – there must be something else going on.
Re 3., there’s some pretty severe axis abuse going on in some of those graphs. Look at the “All Recorded Violence with Injury” one at the top of page 8, for example. The crimes per month axis on the right goes from 0 to 500, so to be comparable, the “rolling 12” axis on the left should be 0 to 6000. But it’s 3,800 to 5,000 – no wonder the thick black line doesn’t seem to bear any relation to the per-month points.
A BBC news item about this says:
“In May, Cambridgeshire Police removed their public switchboard function, transferring all non-999 calls to the Police Service Centre (PSC).
Between May and June, the number of calls to the PSC rose from an average of 700 a day to in excess of 2,000.”
I note the online published scrutiny committee papers for May 2011 (its last meeting) also omitted the “performance pack” so the recent historical statistics are not available:
http://www.cambs-pa.gov.uk/meetingDetail.cfm?MeetingId=375
The issue of call answering statistics was raised by Cllr Tierney (following discussion with me) at Cambridgeshire County Council during the slot where councillors can question the police authority:
http://www.rtaylor.co.uk/police-authority-qs-cambscc.html#phones
A further article on the subject of phone answering performance is at:
http://www.rtaylor.co.uk/cambridgeshire-police-phone-answering-failures-continue.html
In addition I have submitted a freedom of information request, in public, asking for the police phone answering statistics which have not been provided to the Police Authority or County Council:
http://www.whatdotheyknow.com/request/phone_answering_performance_stat