Cambridgeshire County Council’s election results are currently being published. I had received an assurance that the number of spoilt papers would be published alongside the ward by ward results. The council are not doing this, but they are reporting turnout figures on a per-ward basis from which I ought be able to approximate the number of spoilt papers.
I have been attempting to subtract the total number of votes from the turnout in an attempt to calculate the number of spoilt papers (along with those who didn’t post their paper in the ballot box).
However according to the figures published so far it appears there have been more votes allocated to individual candidates than there were people who turned out to vote in a number of Cambridge City wards.
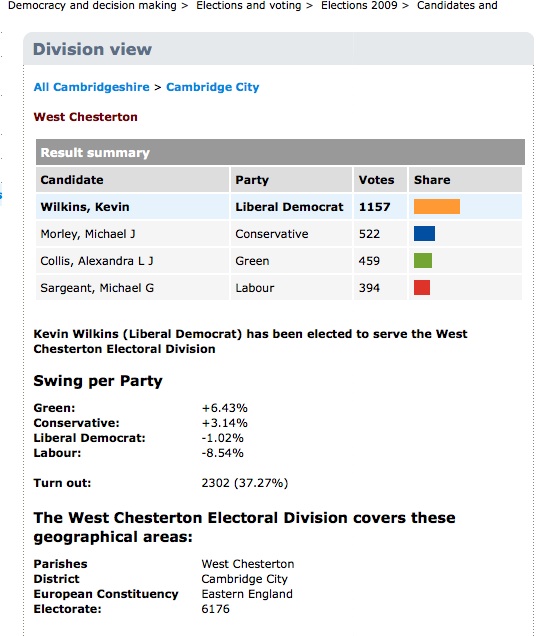
For example the West Chesterton results show:
| Wilkins, Kevin – Liberal Democrat | 1157 |
| Morley, Michael J – Conservative | 522 |
| Collis, Alexandra L J – Green | 459 |
| Sargeant, Michael G – Labour | 394 |
- Total Votes 2532
- Turnout 2302
- Turnout minus total votes counted for the candidates, which I was expecting to reveal the number of spoilt papers, gives me the nonsensical -230
At the very least I’ve not been able to extract the figure for spoilt papers / those who decided to do something else with their paper other than post it in the ballot box. I am wondering what is going on.
Postal votes ought be included in the turnout figures. Have they been?
| Ward | Total Votes | Turnout | Excess of Votes over Turnout |
| West Chesterton | 2302 | 2532 | 230 |
| Romsey | 2330 | 2410 | 80 |
| East Chesterton | 2190 | 2256 | 66 |
| Petersfield | 2364 | 2415 | 51 |
| Coleridge | 2514 | 2557 | 43 |
| Queen Edith’s | 2667 | 2700 | 33 |
| Newnham | 2237 | 2270 | 33 |
| Arbury | 2712 | 2729 | 17 |
| Market | 1877 | 1893 | 16 |
| King’s Hedges | 1905 | 1918 | 13 |
Any explanations in the comments please!
8 responses to “More Votes Counted Than People Who Turned Out in Cambridge”
Thanks for highlighting this Richard – such an important story and you have to wonder where else it is replicated in the country.
It appears the “Turnout” figures published for Cambridgeshire’s 2005 elections were as far as I can see, always, equal to the total number of votes cast for candidates. ie. not showing anyone spoiling their papers etc.
Hmmm, I also thought they were going to issue the number of spoiled ballot papers. This is a bit scary.
Do postal votes count as ‘turnout’?
There were not that many spolit papers. In Trumpington there were 25 papers not included in the main count, of which ~3 came back after the agent checks, so we are looking at ~20 spolit papers from ~2200 votes.
John, in Trumpington the published results show :
Turnout : 2317
Total Votes: 2272
Turnout minus votes (spoilt etc.): 45
That is potentially compatible with what you, as a candidate, observed.
Richard, I’m not surprised – the electoral administration was shambolic this year.
I have now been told that the original turnout figures quoted were wrong. These have now been corrected on the council’s website.
There were in fact ten spoilt papers in West Chesterton, not minus two hundred and thirty.